erwin.capitan

Data & BI Analyst · Analytics Engineering · Davao City, PH

Erwin Glenn
Capitan II I find what the numbers are hiding, then build the reporting that keeps it visible.

Most reports tell you what happened last month. My work answers what to change — where working capital is stuck, which products lose money once discounts are counted, which costs are drifting off budget.

~$95K estimated working capital trapped in slow-moving inventory
20% the discount threshold above which every order starts losing money
1 click replaces a manual monthly P&L cycle — change one date, everything re-points

Findings from public-data builds, each documented end to end below.

The pipelines underneath — ingestion, modeling, history tracking — are how I make those answers trustworthy enough to act on. I started as a Credit & Risk Analyst, then ran branch operations analytics: inventory, expenses, liquidations, staff performance. After seven years teaching, I came back to data full time.

4+ yrs analytics & reporting Power BI since 2018 7 public projects, documented

Erwin Glenn Capitan II
Available for work◆ open

How I build

From raw data to a number someone can act on.

Every platform I ship follows the same spine. Load only what changed, clean it once, and hand the business a model it can query without asking me first.

SELECT * FROM dbo.FactStream WHERE stream_timestamp > '@last_watermark'

01 — Bronze

Land it raw

Metadata-driven ingestion. One parameterised pipeline loops every table instead of one pipeline per table.

  • Watermark-based incremental loading
  • Parquet landing on ADLS Gen2
  • ForEach + config array, not copy-paste
  • Failure alerting on the pipeline
02 — Silver

Make it trustworthy

Auto Loader streams bronze into Delta with checkpoints, so a rerun never double-counts. Shared transforms live in one class.

  • Auto Loader + schema evolution
  • Reusable transformation library
  • Row-count reconciliation vs bronze
  • Data quality expectations
03 — Gold

Model it for answers

Kimball star schemas with real history. SCD Type 2 dimensions keep yesterday's truth queryable next to today's.

  • Slowly Changing Dimensions, Type 1 & 2
  • Conformed dims, fact grain declared
  • Semantic model + DAX measure layer
  • Power BI on top, not instead

Selected work

Built, documented, and public.

Each repo ships with the architecture, the code, and the validation queries I used to prove it works.

Featured case study

Supply Chain Analytics

Business problem
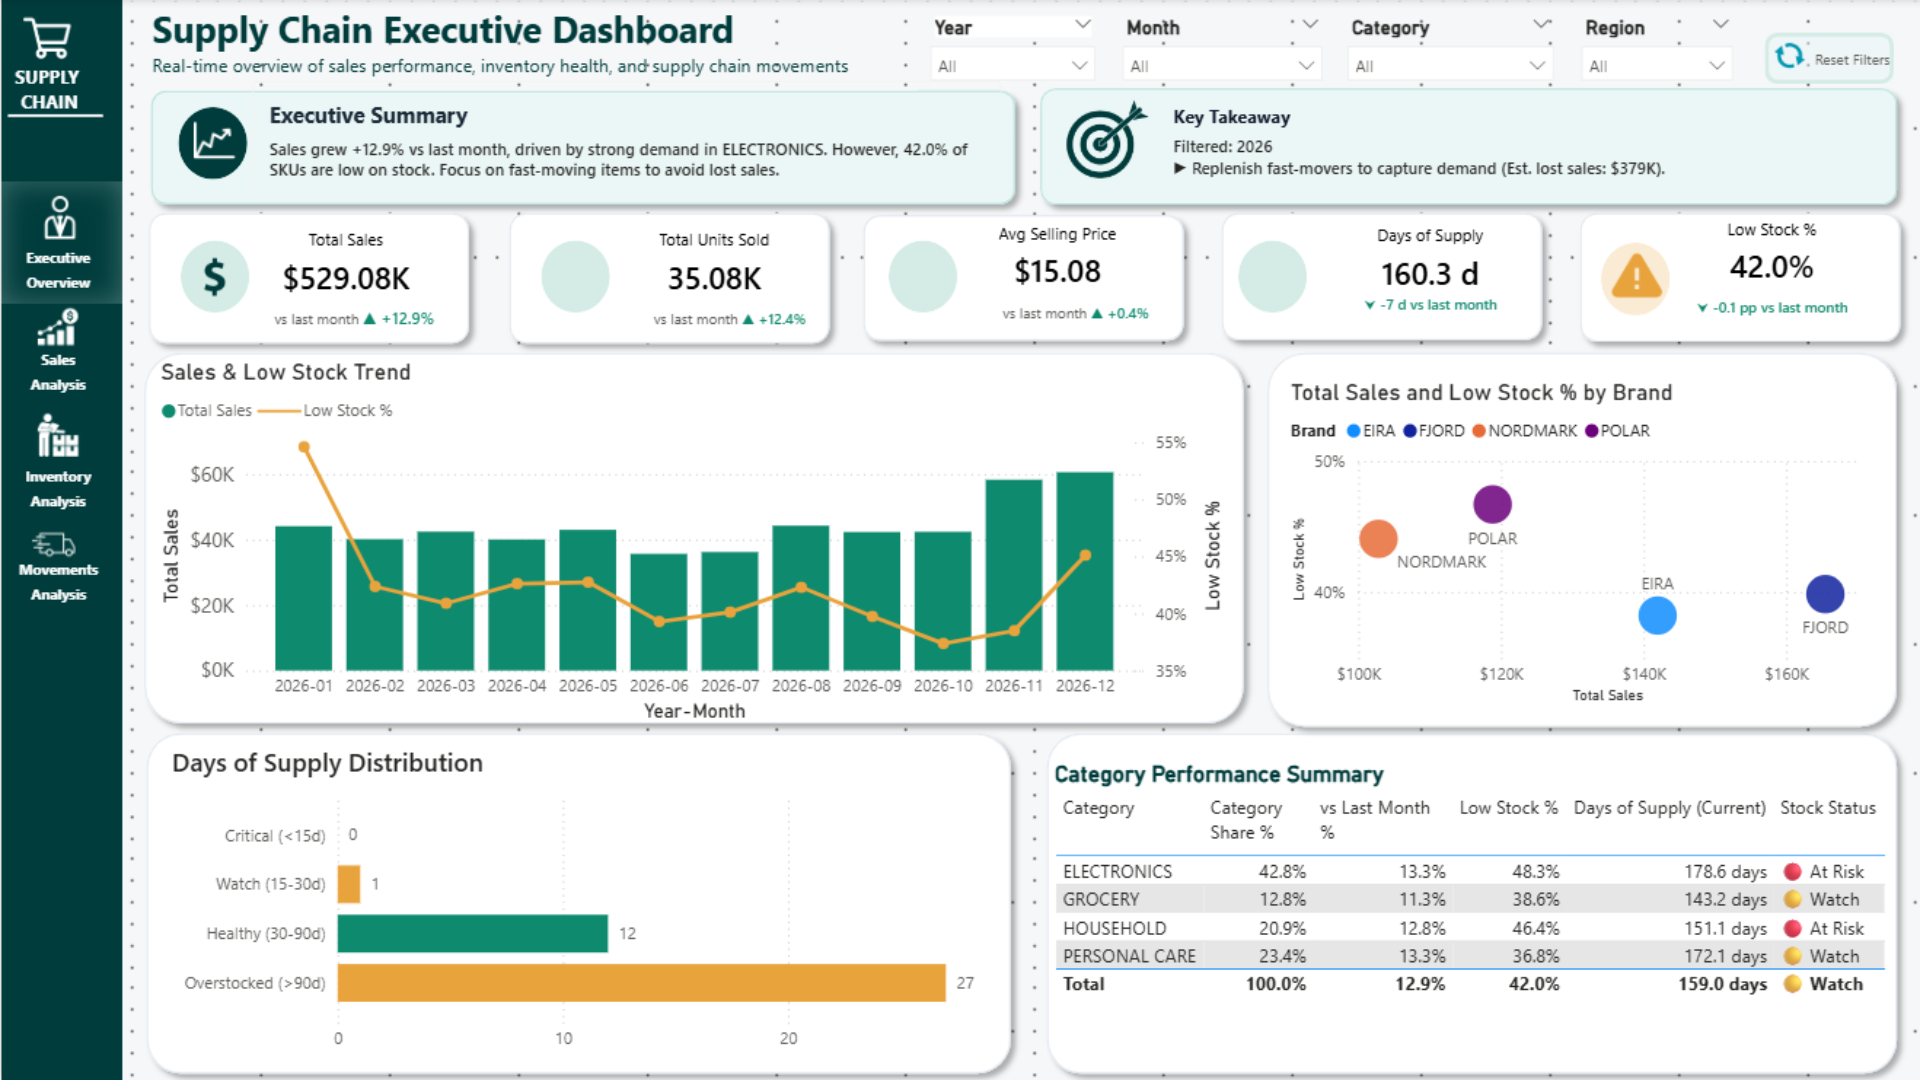
Inventory was tying up working capital with no clear view of what was aging, where it sat, or what it was costing to hold.
What I built
A medallion lakehouse on DuckDB and Parquet feeding a Kimball star schema, a Power BI dashboard with 101 DAX measures, and an executive briefing for the people who sign off on inventory.
Result
An estimated ~$95K in working capital identified as trapped in slow-moving stock, with the driving items and locations named rather than left as a total.
DuckDBParquetKimballPower BIDAX
Read the case study →

Other selected work

glcapitan / fabric-medallion-retail-pipeline

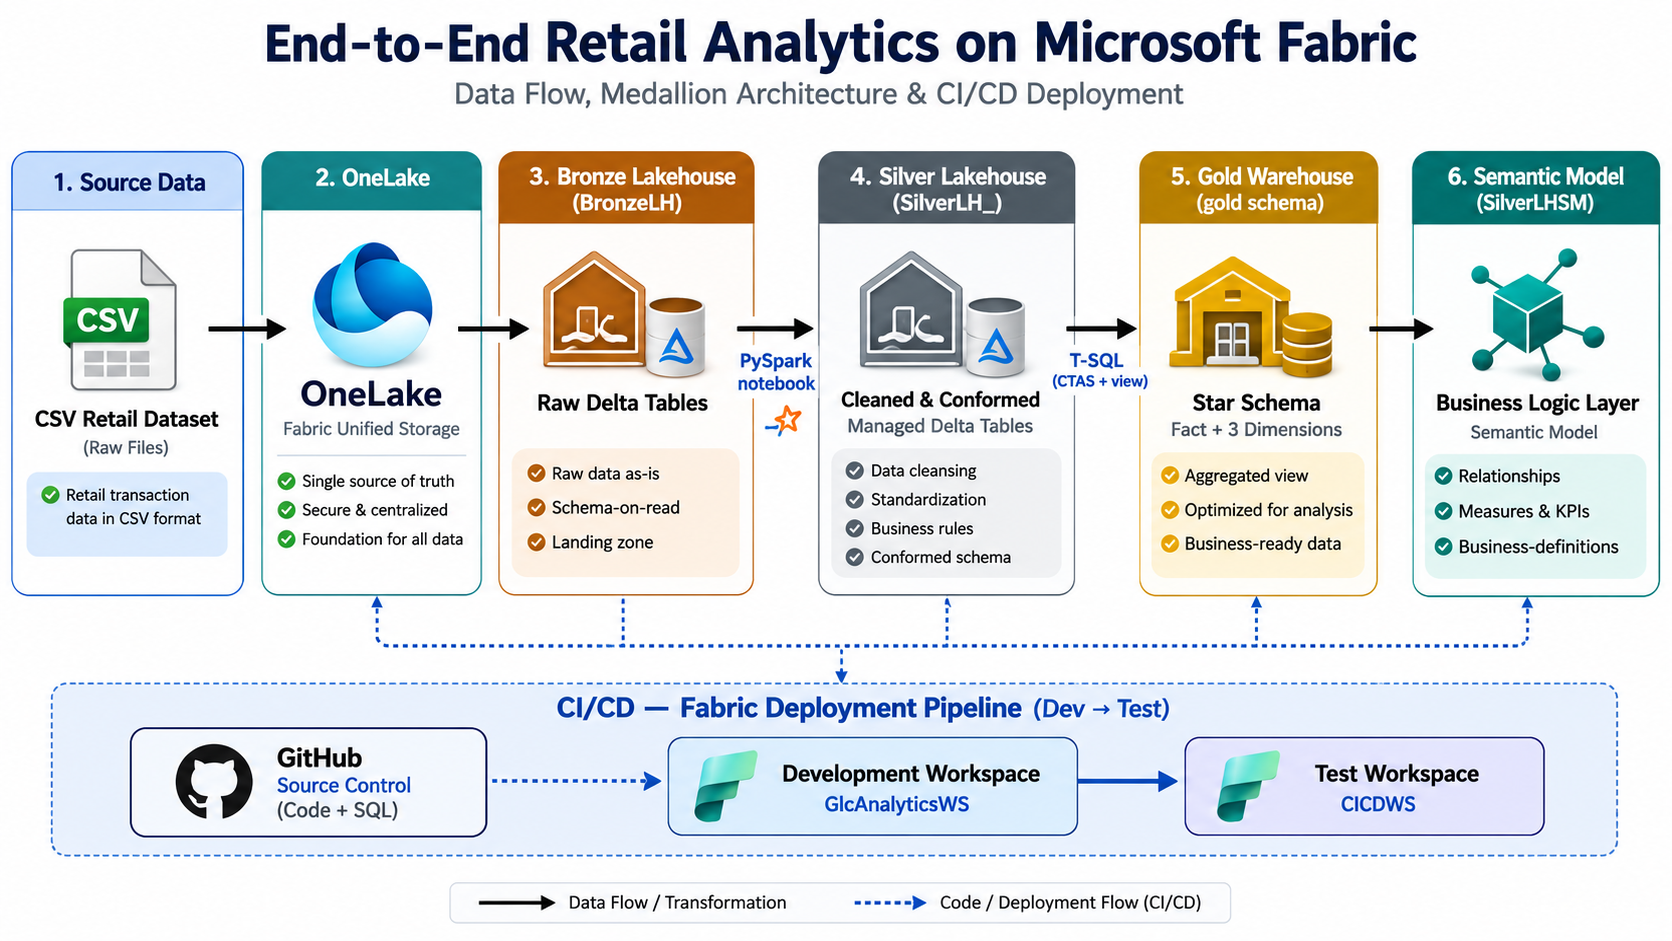
Retail Analytics on Microsoft Fabric

An end-to-end retail analytics platform: ingestion, transformation and dimensional modeling automated, so Power BI reports run off a governed warehouse — and promote between environments without a rebuild.

Bronze → Silver → Gold, with real CI/CD
Microsoft FabricPySparkT-SQLDeployment PipelinesPower BI
Read the project summary →
glcapitan / azureproject

Azure SQL → Lakehouse, with SCD2 History

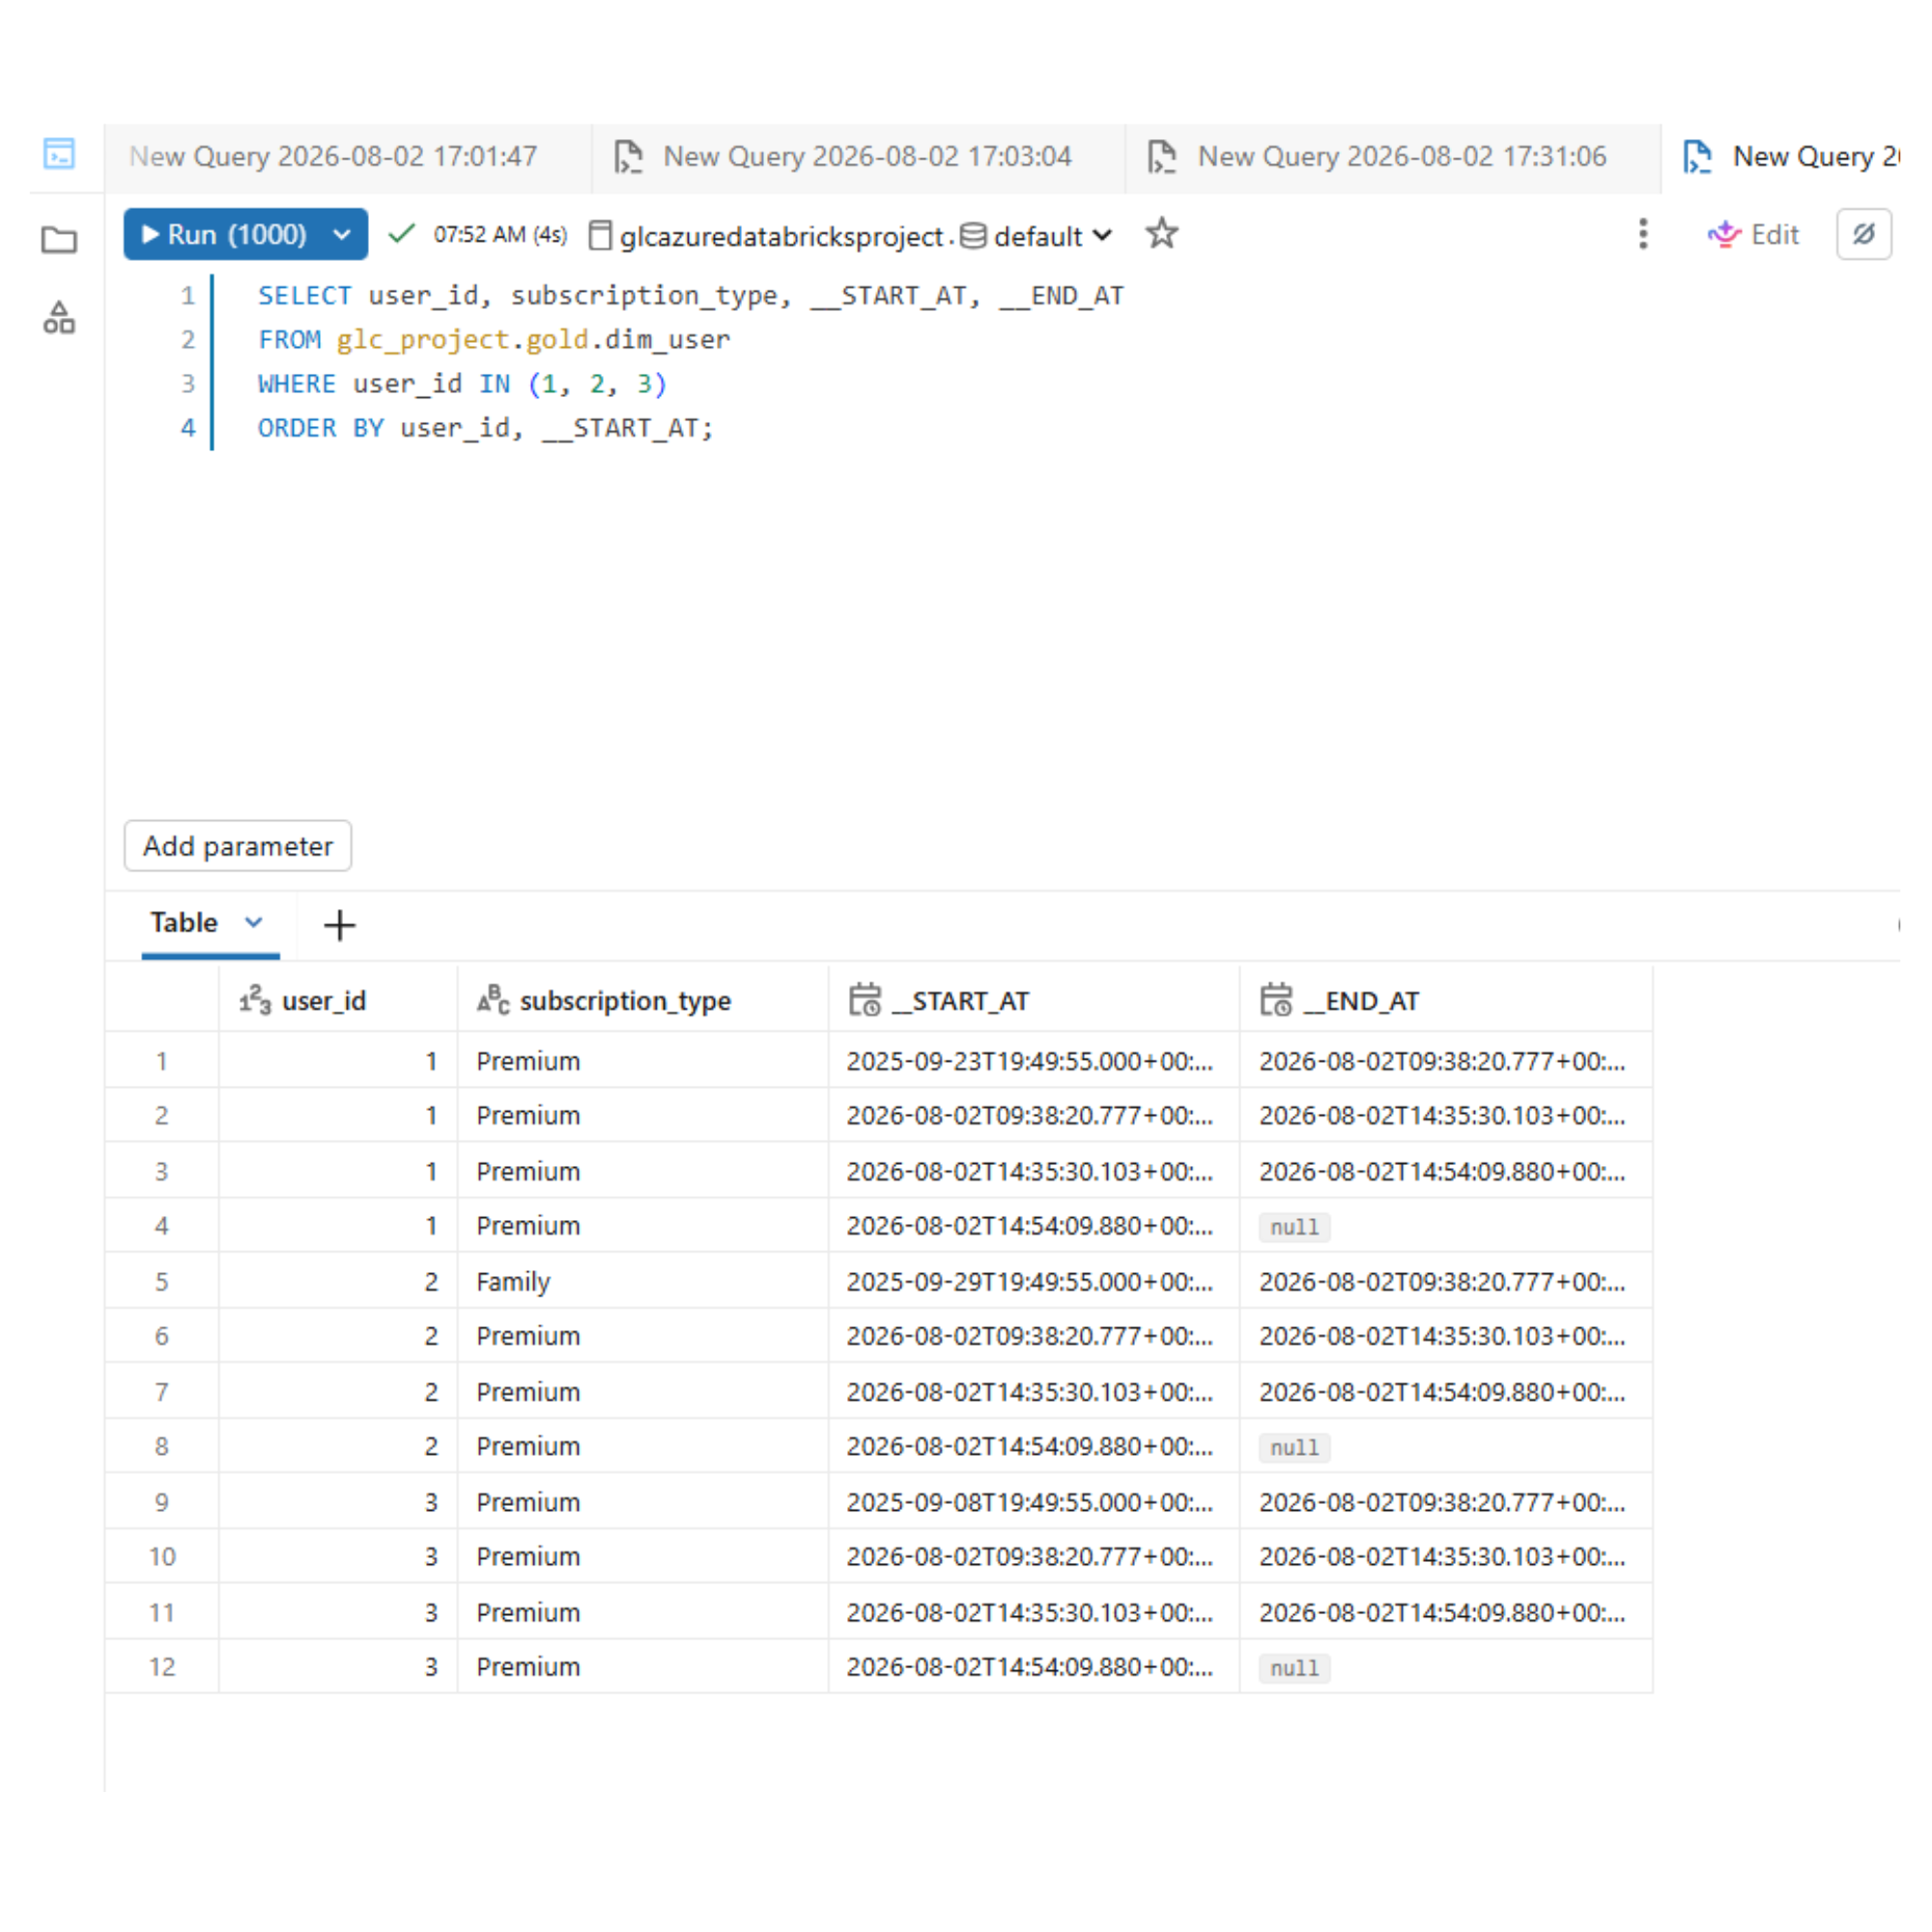
A warehouse that can still answer what a customer's plan was last quarter. Incremental loading keeps it cheap; Type 2 history keeps yesterday's truth queryable — both proven with a live change test.

SCD2 verified: 509 silver → 509 gold → 500 current rows
Azure Data FactoryDatabricksDelta Live TablesUnity CatalogPySpark
Read the project summary →
glcapitan / tableau-sales-customer-dashboard

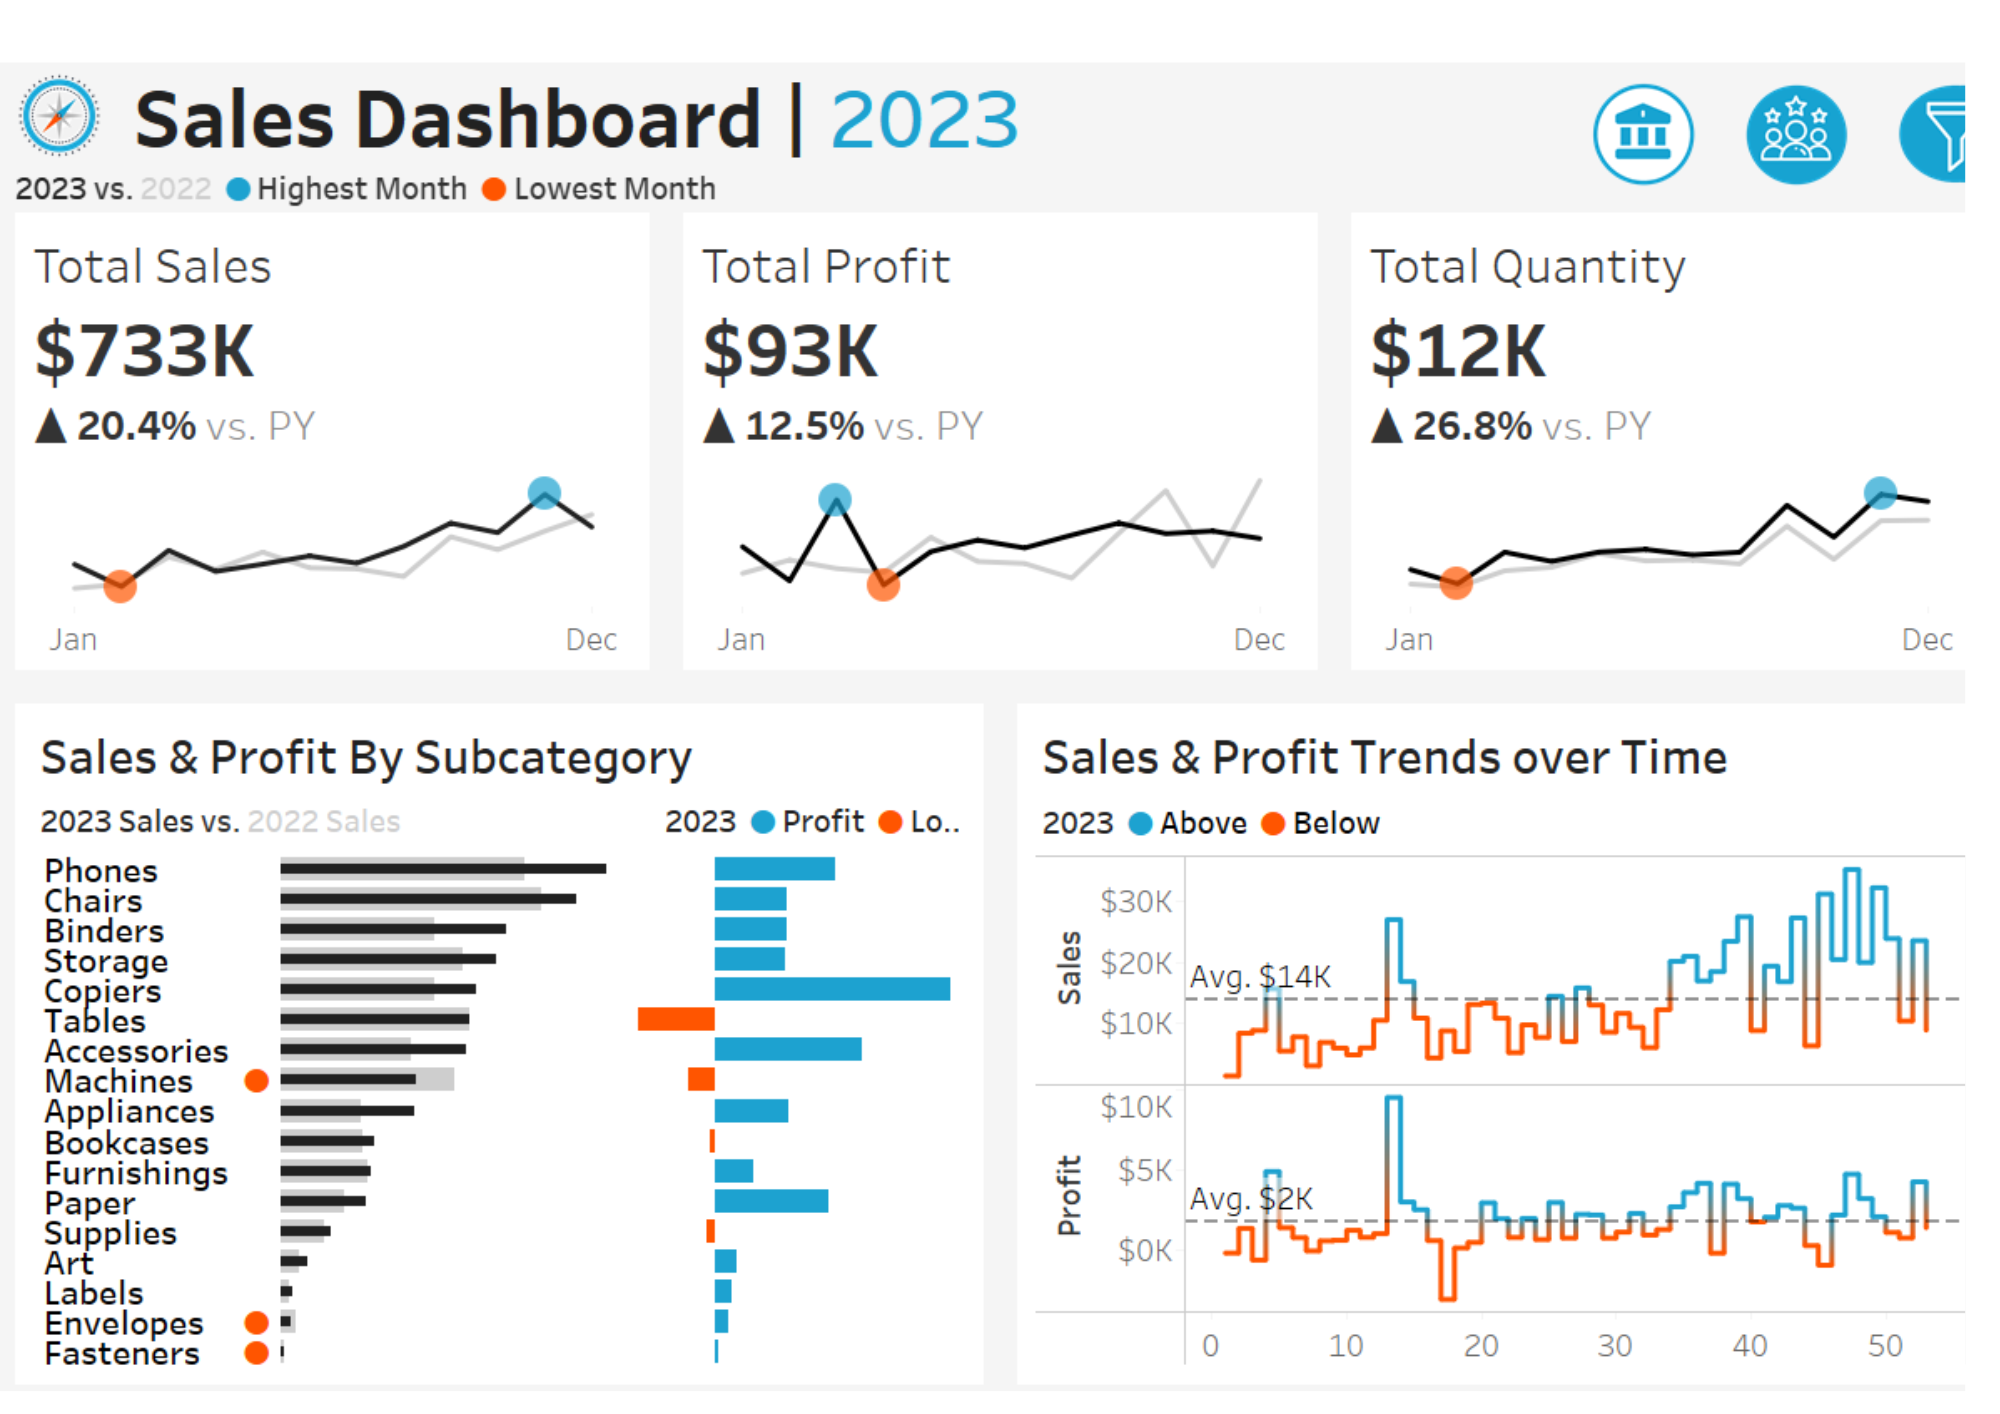
Sales & Customer Performance

Found the point where discounting stops paying for itself, and which products quietly destroy margin — across 9,994 transactions, in two linked dashboards driven by one shared parameter.

Margin turns negative above a 20% discount · 16.2% of products destroy $76.7K
TableauParametersSegmentationProfitability
Read the project summary →
glcapitan / financial-performance-dashboard

Financial Performance Dashboard

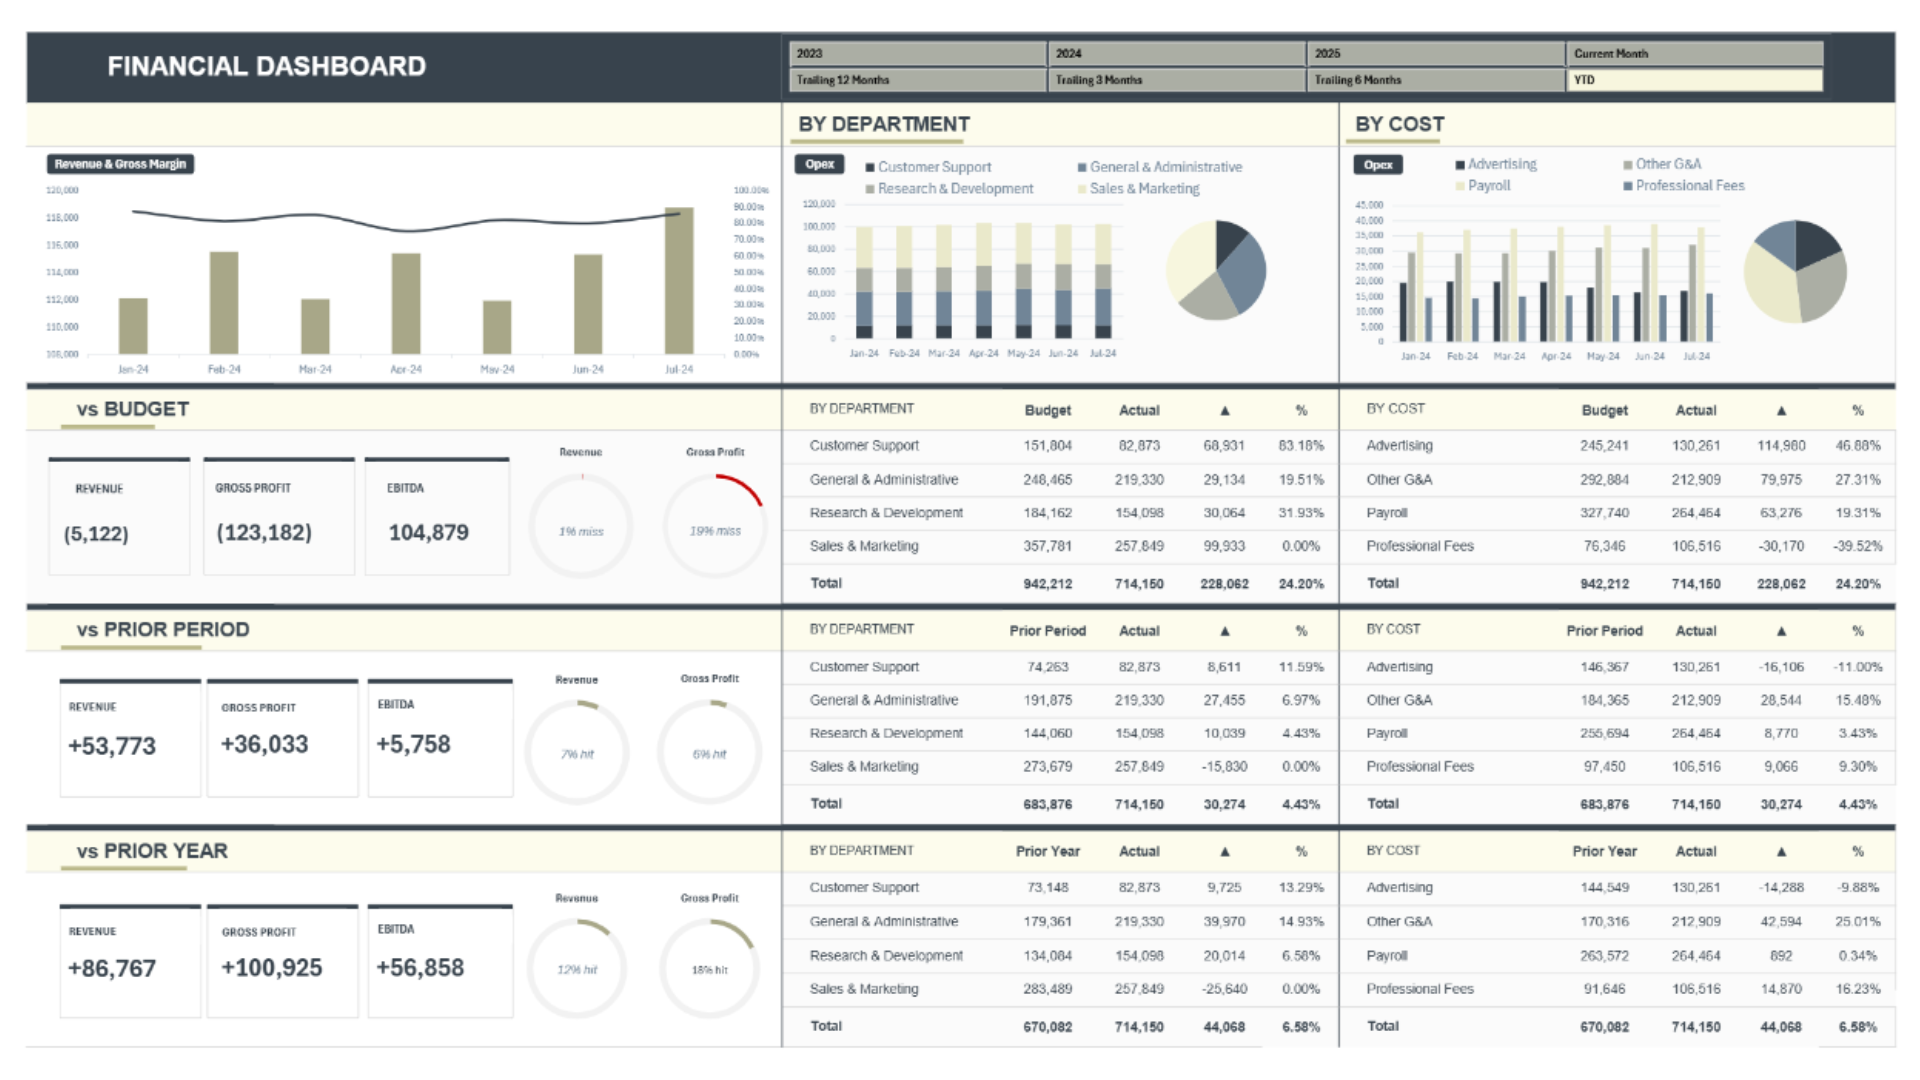
Replaces a manual monthly P&L reporting cycle: change one date cell, refresh, and every KPI, variance and chart re-points against budget, prior period and prior year.

Star schema in Power Pivot · full time-intelligence measure layer
ExcelPower QueryPower PivotDAXFP&A
Read the project summary →
glcapitan / microsoft-fabric-nyc-taxi-analytics

NYC Taxi Analytics Platform

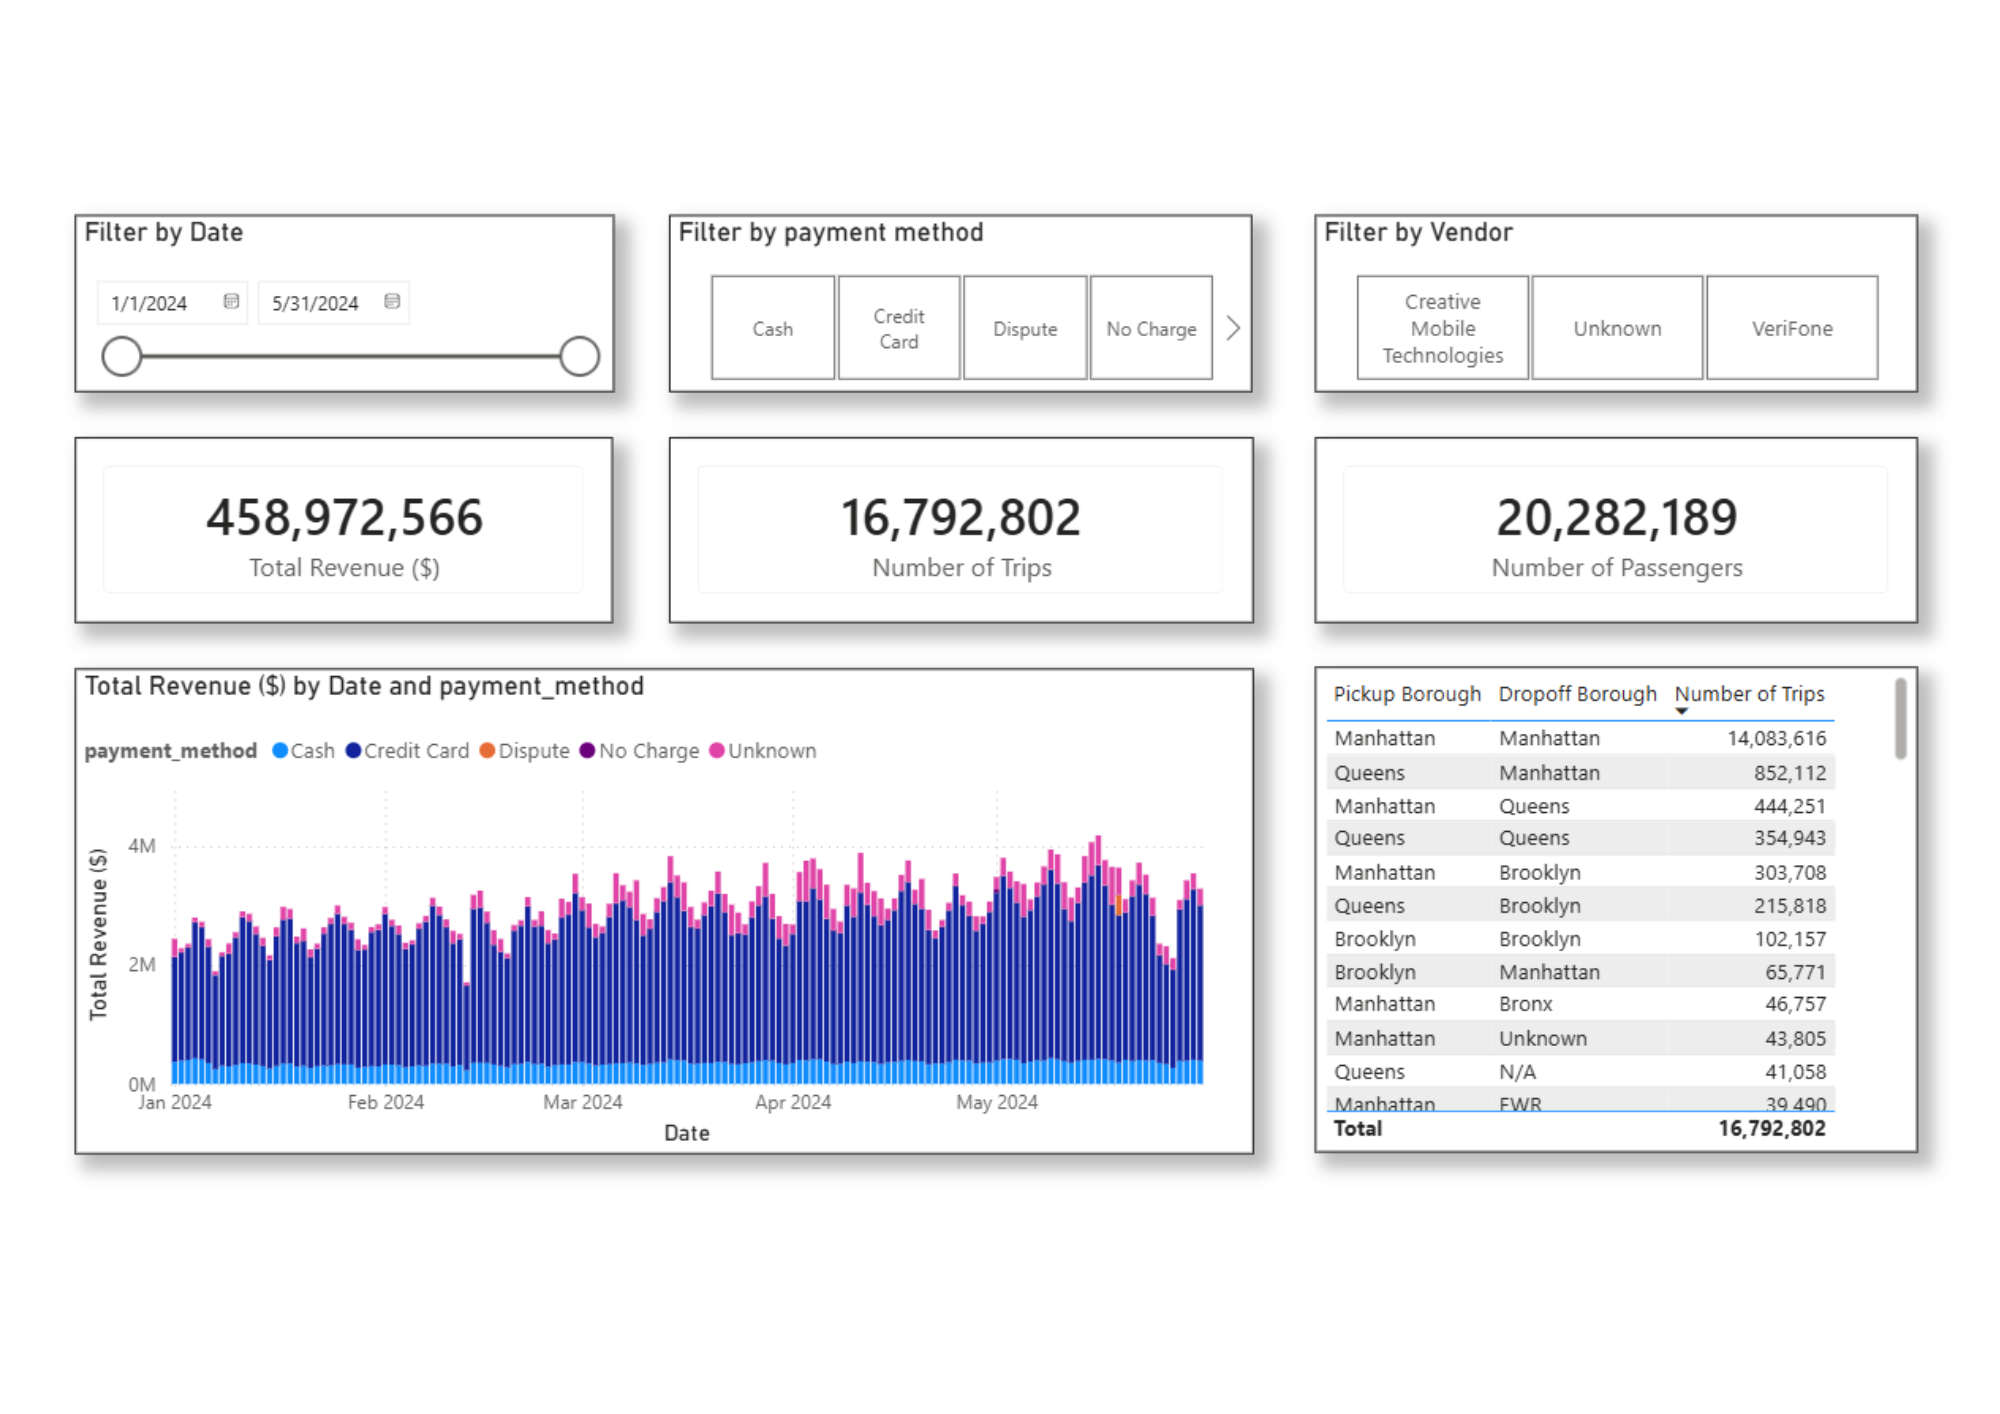
Keeps a high-volume dataset current without a full reload every run — metadata-driven pipelines into a SQL Warehouse, with measures defined once in the semantic model rather than per visual.

Incremental loading at high volume
Microsoft FabricData FactorySQL WarehousePower BI
Read the project summary →
glcapitan / fintech-analytics

Fintech Fraud Analytics

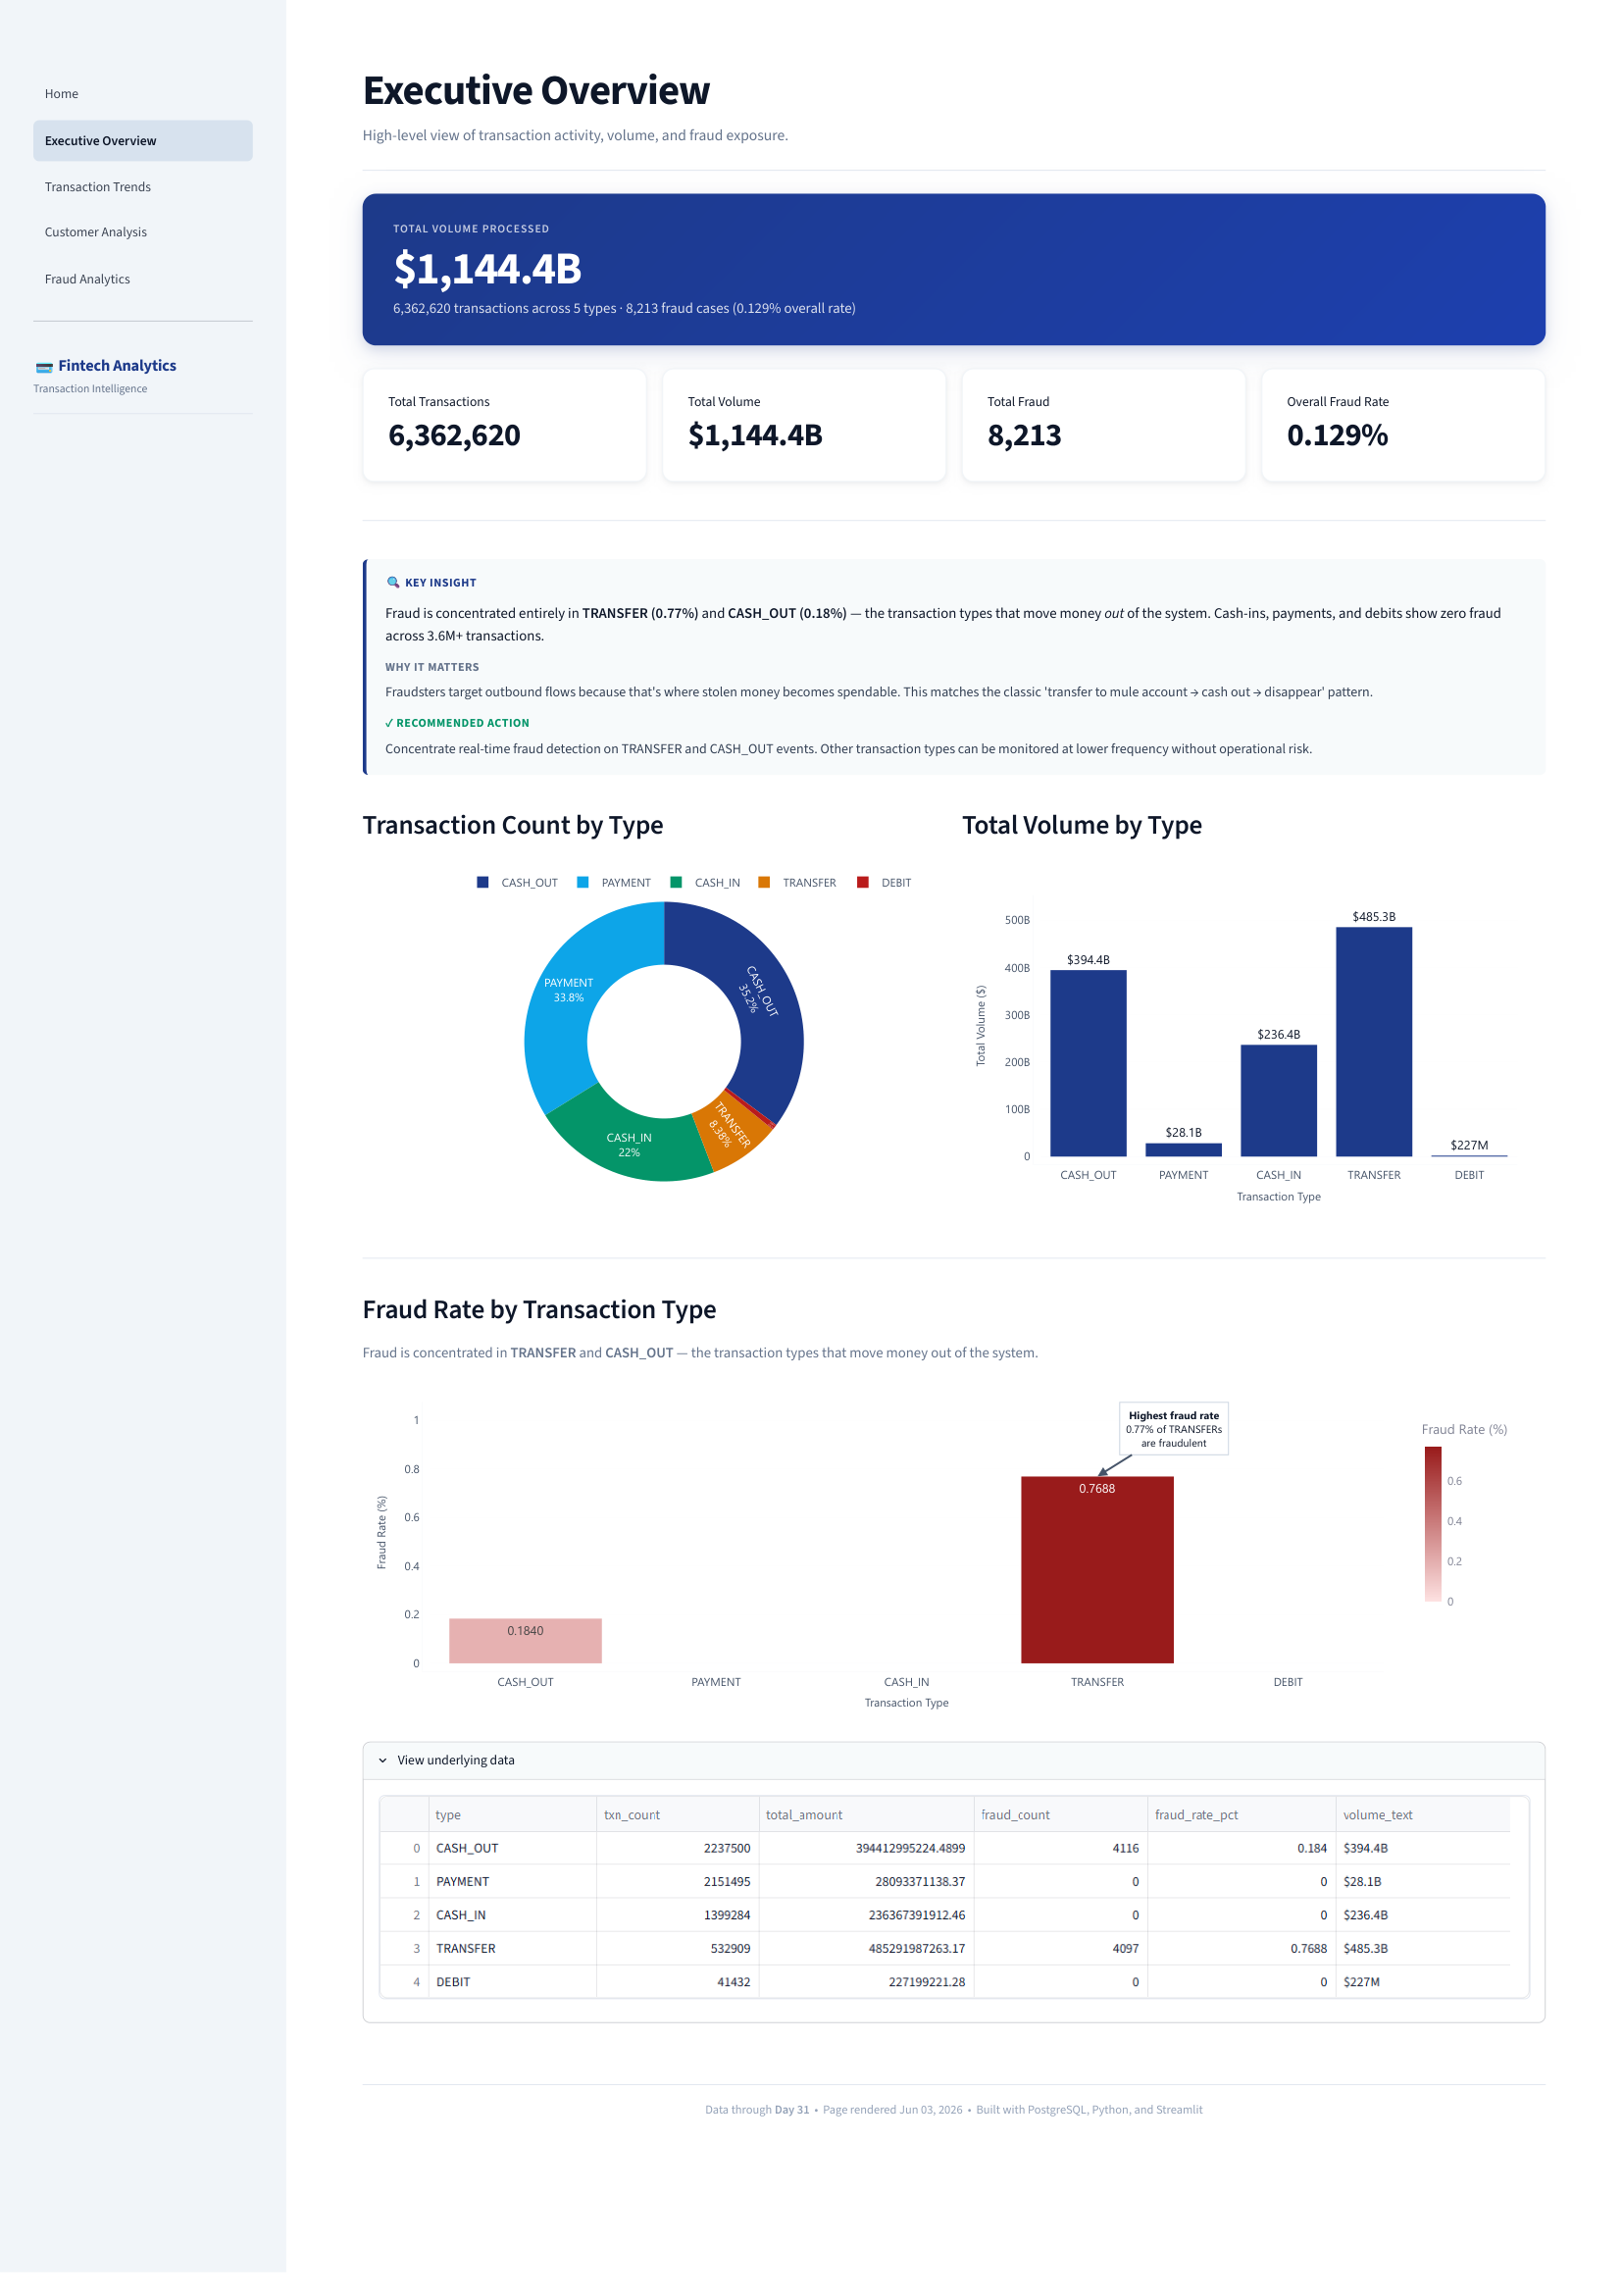
Rare-event analysis where the signal is a fraction of a percent of the rows: which transaction types carry fraud, and what separates a fraudulent transfer from a normal one.

6.3M transactions analysed · deployed live
PythonPostgreSQLStreamlitNeon
Read the project summary →

Stack

Tools I reach for.

Grouped by how deeply I actually use them, not by how impressive the logo looks.

Primary — daily drivers

  • Power BI
  • SQL Server / T-SQL
  • Microsoft Fabric
  • Excel / VBA
  • Python

Working knowledge — used in shipped projects

  • Azure Data Factory
  • Databricks
  • PySpark
  • Tableau
  • PostgreSQL
  • Streamlit
  • Git & GitHub

Exploring

  • Snowflake
  • dbt
  • Airflow

Methods & modeling

AI-assisted development

  • Claude
  • ChatGPT
  • Gemini
  • GitHub Copilot

Beyond the tools

The domains I've actually worked in.

2015–2018 · Credit & Risk

Financial & credit risk analysis

Exposure, collections behaviour and portfolio quality — turned into the reporting the business made lending decisions from.

4+ years, every role

Business analysis

Sitting with the people who own the process and turning "we need a report" into a defined grain, an agreed metric, and someone accountable for it.

2018–2019 + portfolio

Supply chain & inventory

Warehouse stock levels and inventory monitoring in branch operations; a lakehouse-to-Power BI build that surfaced ~$95K in trapped capital.

2018–2019 · Branch ops

Operations analytics

Branch expenses, liquidations and staff performance on daily KPI monitoring — the numbers a supervisor is answerable for every morning.

Portfolio project

Fraud & transaction analytics

Pattern analysis across 6.3M PaySim transactions in PostgreSQL and Python — rare-event detection where the signal is a fraction of a percent of the rows.

Internship + freelance

Executive reporting

Case studies and briefing decks written for the people who approve the budget, not for other analysts.

Stakeholder communication Requirements gathering Metric definition & documentation Training & enablement Client delivery & handover Remote across time zones

Path

Numbers first, teaching in the middle, platforms now.

2025 — present

Data & BI Analyst · Freelance

Self-employed · remote

Dashboards, data models, and end-to-end platform builds for clients — plus the public portfolio projects above.

Jan — Jun 2025

Data Analyst Intern

EXCELHelpline · client engagement under confidentiality

Six months on a live client account: five years of transactional sales data analysed for trend and seasonality, product and category performance, customer segmentation and per-city regional performance — delivered as a Power BI report with findings and recommendations.

2019 — 2025

Teaching

Seven years in the classroom

Seven years translating complex material for people who did not ask for the technical version — communication, training and stakeholder management. It is now how I run dashboard walkthroughs and document what a metric actually means.

2018 — 2019

Branch Operations Supervisor

Personal Collection Direct Selling Inc.

Ran branch analytics end to end: warehouse inventory levels, branch expenses, liquidations, stock monitoring and staff performance — daily KPI monitoring in Excel, VBA and Power BI.

2015 — 2018

Credit & Risk Analyst

Personal Collection Direct Selling Inc.

Owned the credit and risk data — exposure, collections behaviour, and the reporting the business made lending decisions from.

Credentials

Certifications

Earned

Full-Stack Data Analytics

EXCELHelpline

In progress

Microsoft Fabric Data Engineer Associate — DP-700

Microsoft

In progress

dbt Analytics Engineering

dbt Labs

Contact

What can I help you figure out?

Open to BI and analytics engineering roles, and to freelance work. Based in Davao City, working across time zones. Tell me what you are working with and I will tell you honestly whether I am the right fit.

Power BI & reporting

  • Dashboard design and build
  • DAX measures and data models
  • Power Query cleanup
  • KPI and metric definition

Analysis

  • SQL reporting and investigation
  • Sales, customer and financial analysis
  • Inventory and operations reporting
  • Excel automation

Data engineering

  • Fabric and Azure pipelines
  • Incremental and metadata-driven loads
  • Star schemas and history tracking
  • Data quality checks